

Project - 2023
De Bijenkorf web filter redesign
Background
The filtering capability is one of the most critical components for the success of any e-commerce business. At De Bijenkorf we decided to revamp the existing filter, which was deemed outdated and underperforming.
I was tasked with the filter redesign, with the ambitious goal of increasing the conversion rate by 3%.
The business goal
- Increase the filter conversion rate by 3%.
The user goal
- Easy to find the right product
My Role
- User research
- UX design
- UI design
- Data analysis
What did I do?
Identify & Prioritize Customer Problems
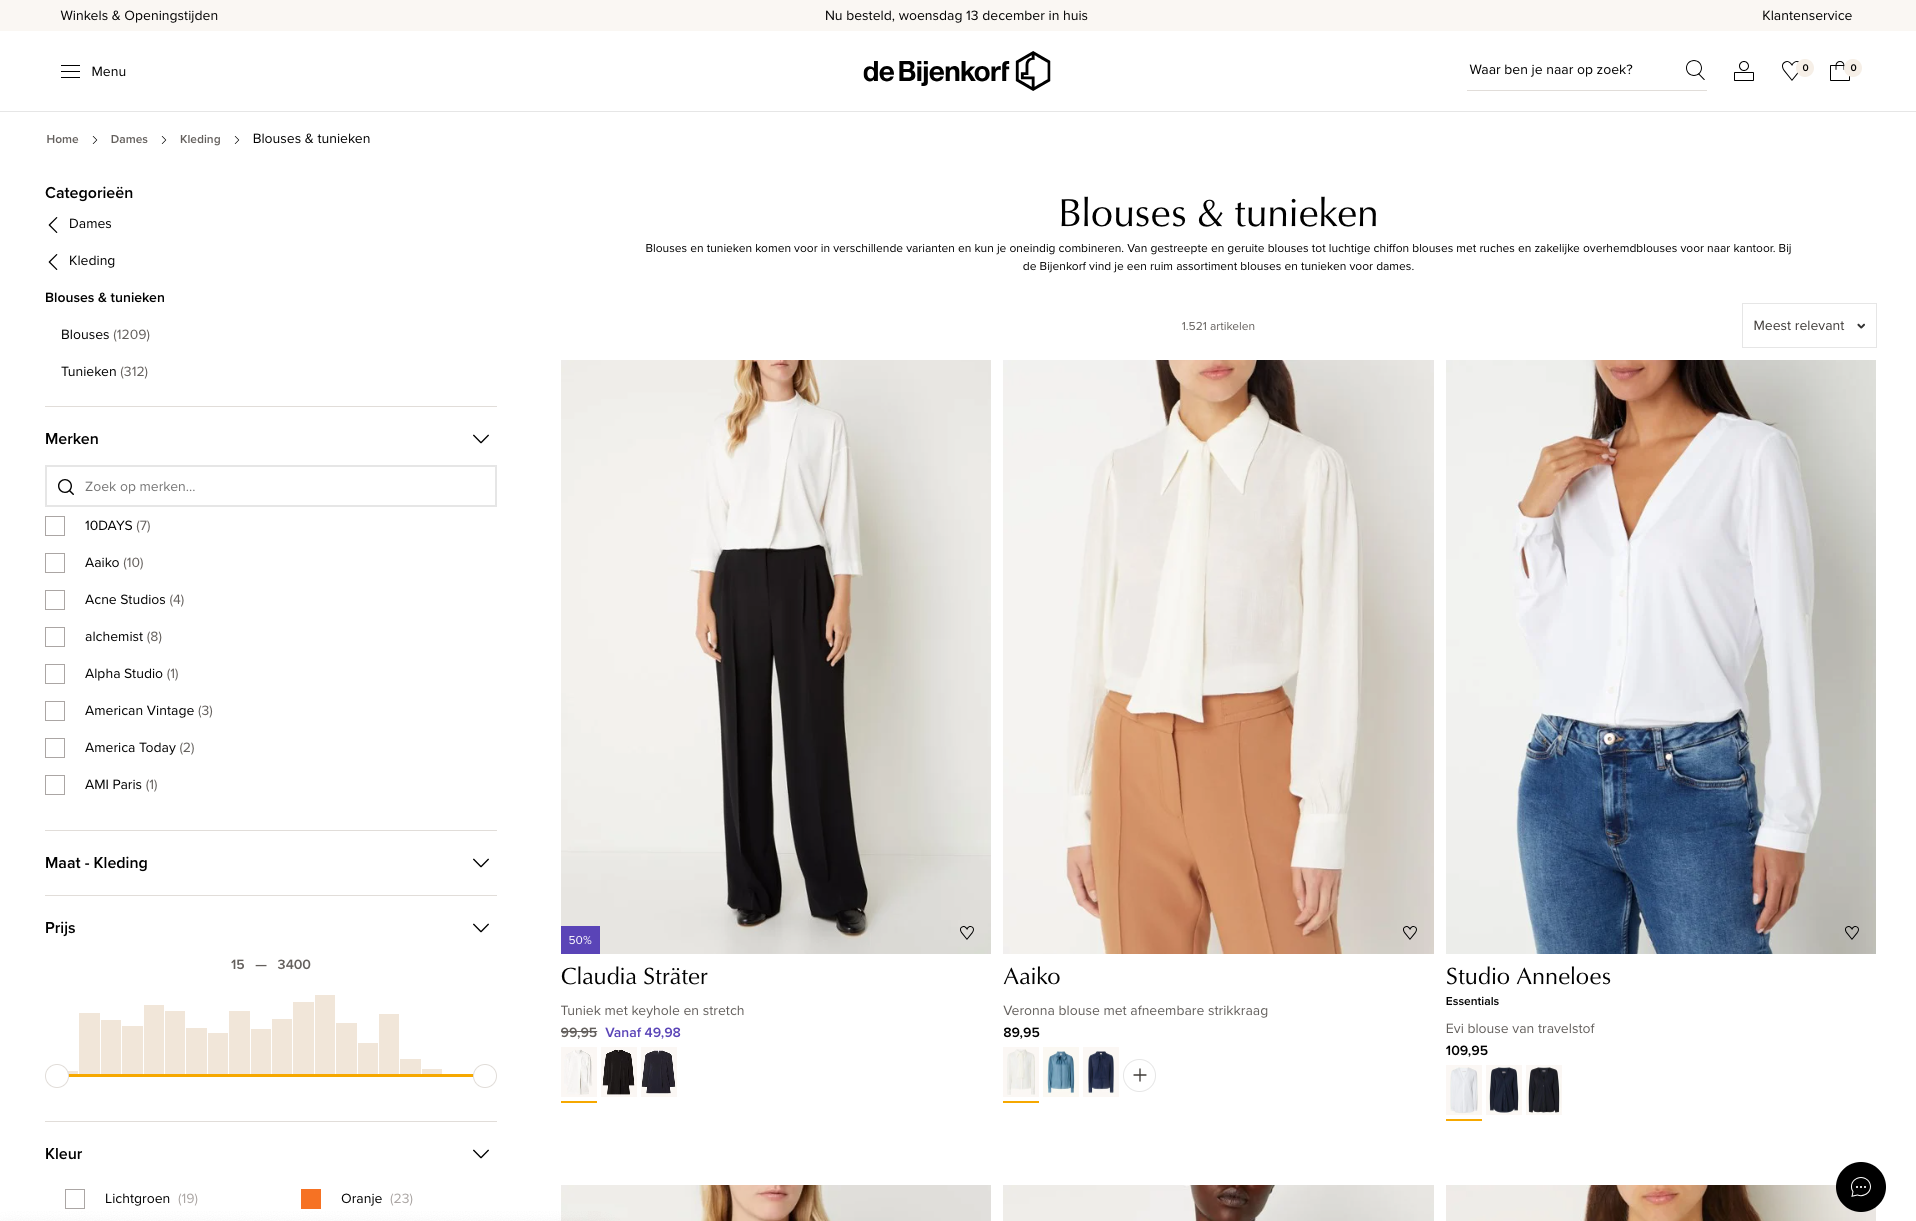
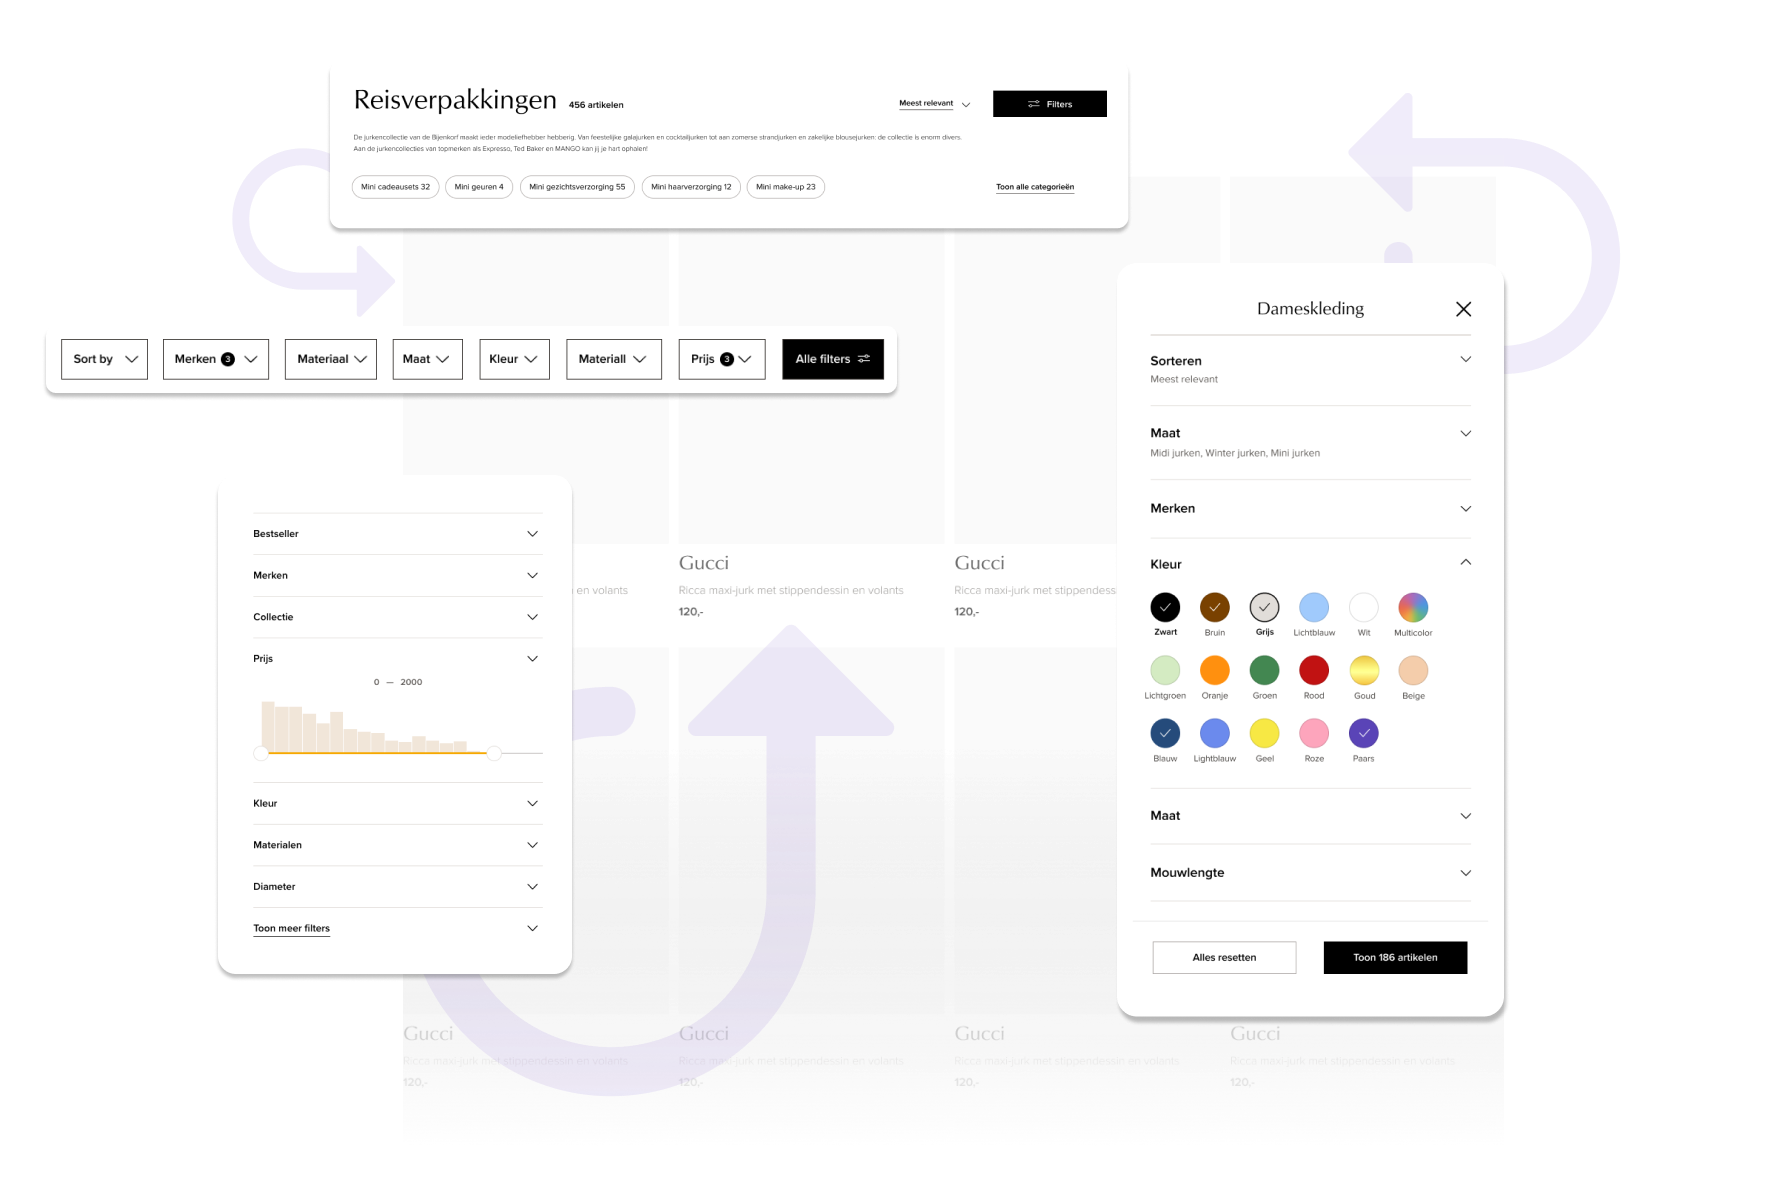
Current filter design
I identified the customer problems based on data, user feedback, Baymard & Nngroup research and our previous research insights. There are many of them, clearly, not all of these can be addressed at once. Therefore, I categorized these problems into three groups to create a well-defined prioritization plan and aligned this plan with stakeholders like the conversion, CRO, data, category team.

How to measure success?
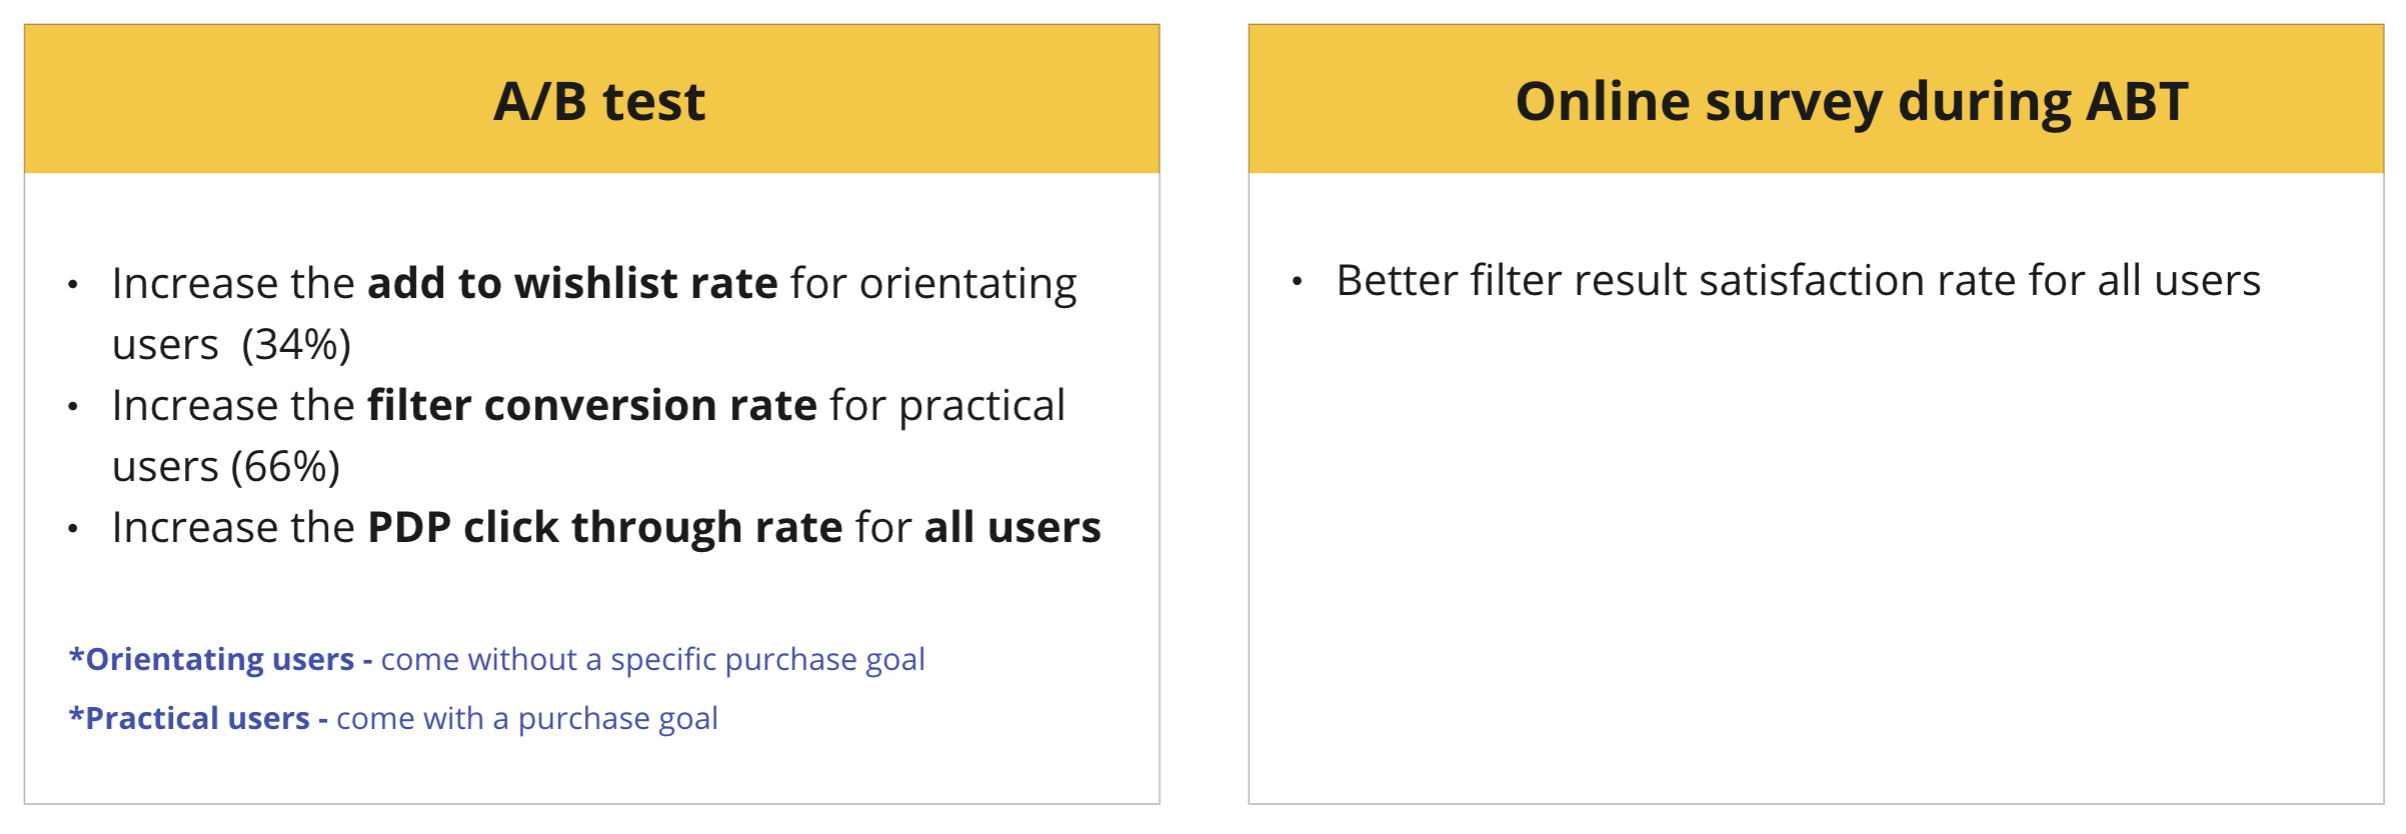
Before I start to work on the task, I always defined with stakeholders about how we measure success, we decided together to use A/B testing and online survey to measure success from business perspective and user perspective :
What are the user needs/goals in using filter?
There are different needs based on the different scenarios in using filter, so I conducted a focus group discussion to uncover these questions below:
- What are the scenarios when users use filters?
- What are the User Goals in these scenarios?
- What are the User Needs in each scenario?
- What kind of filter interaction do they prefer based on these scenarios?
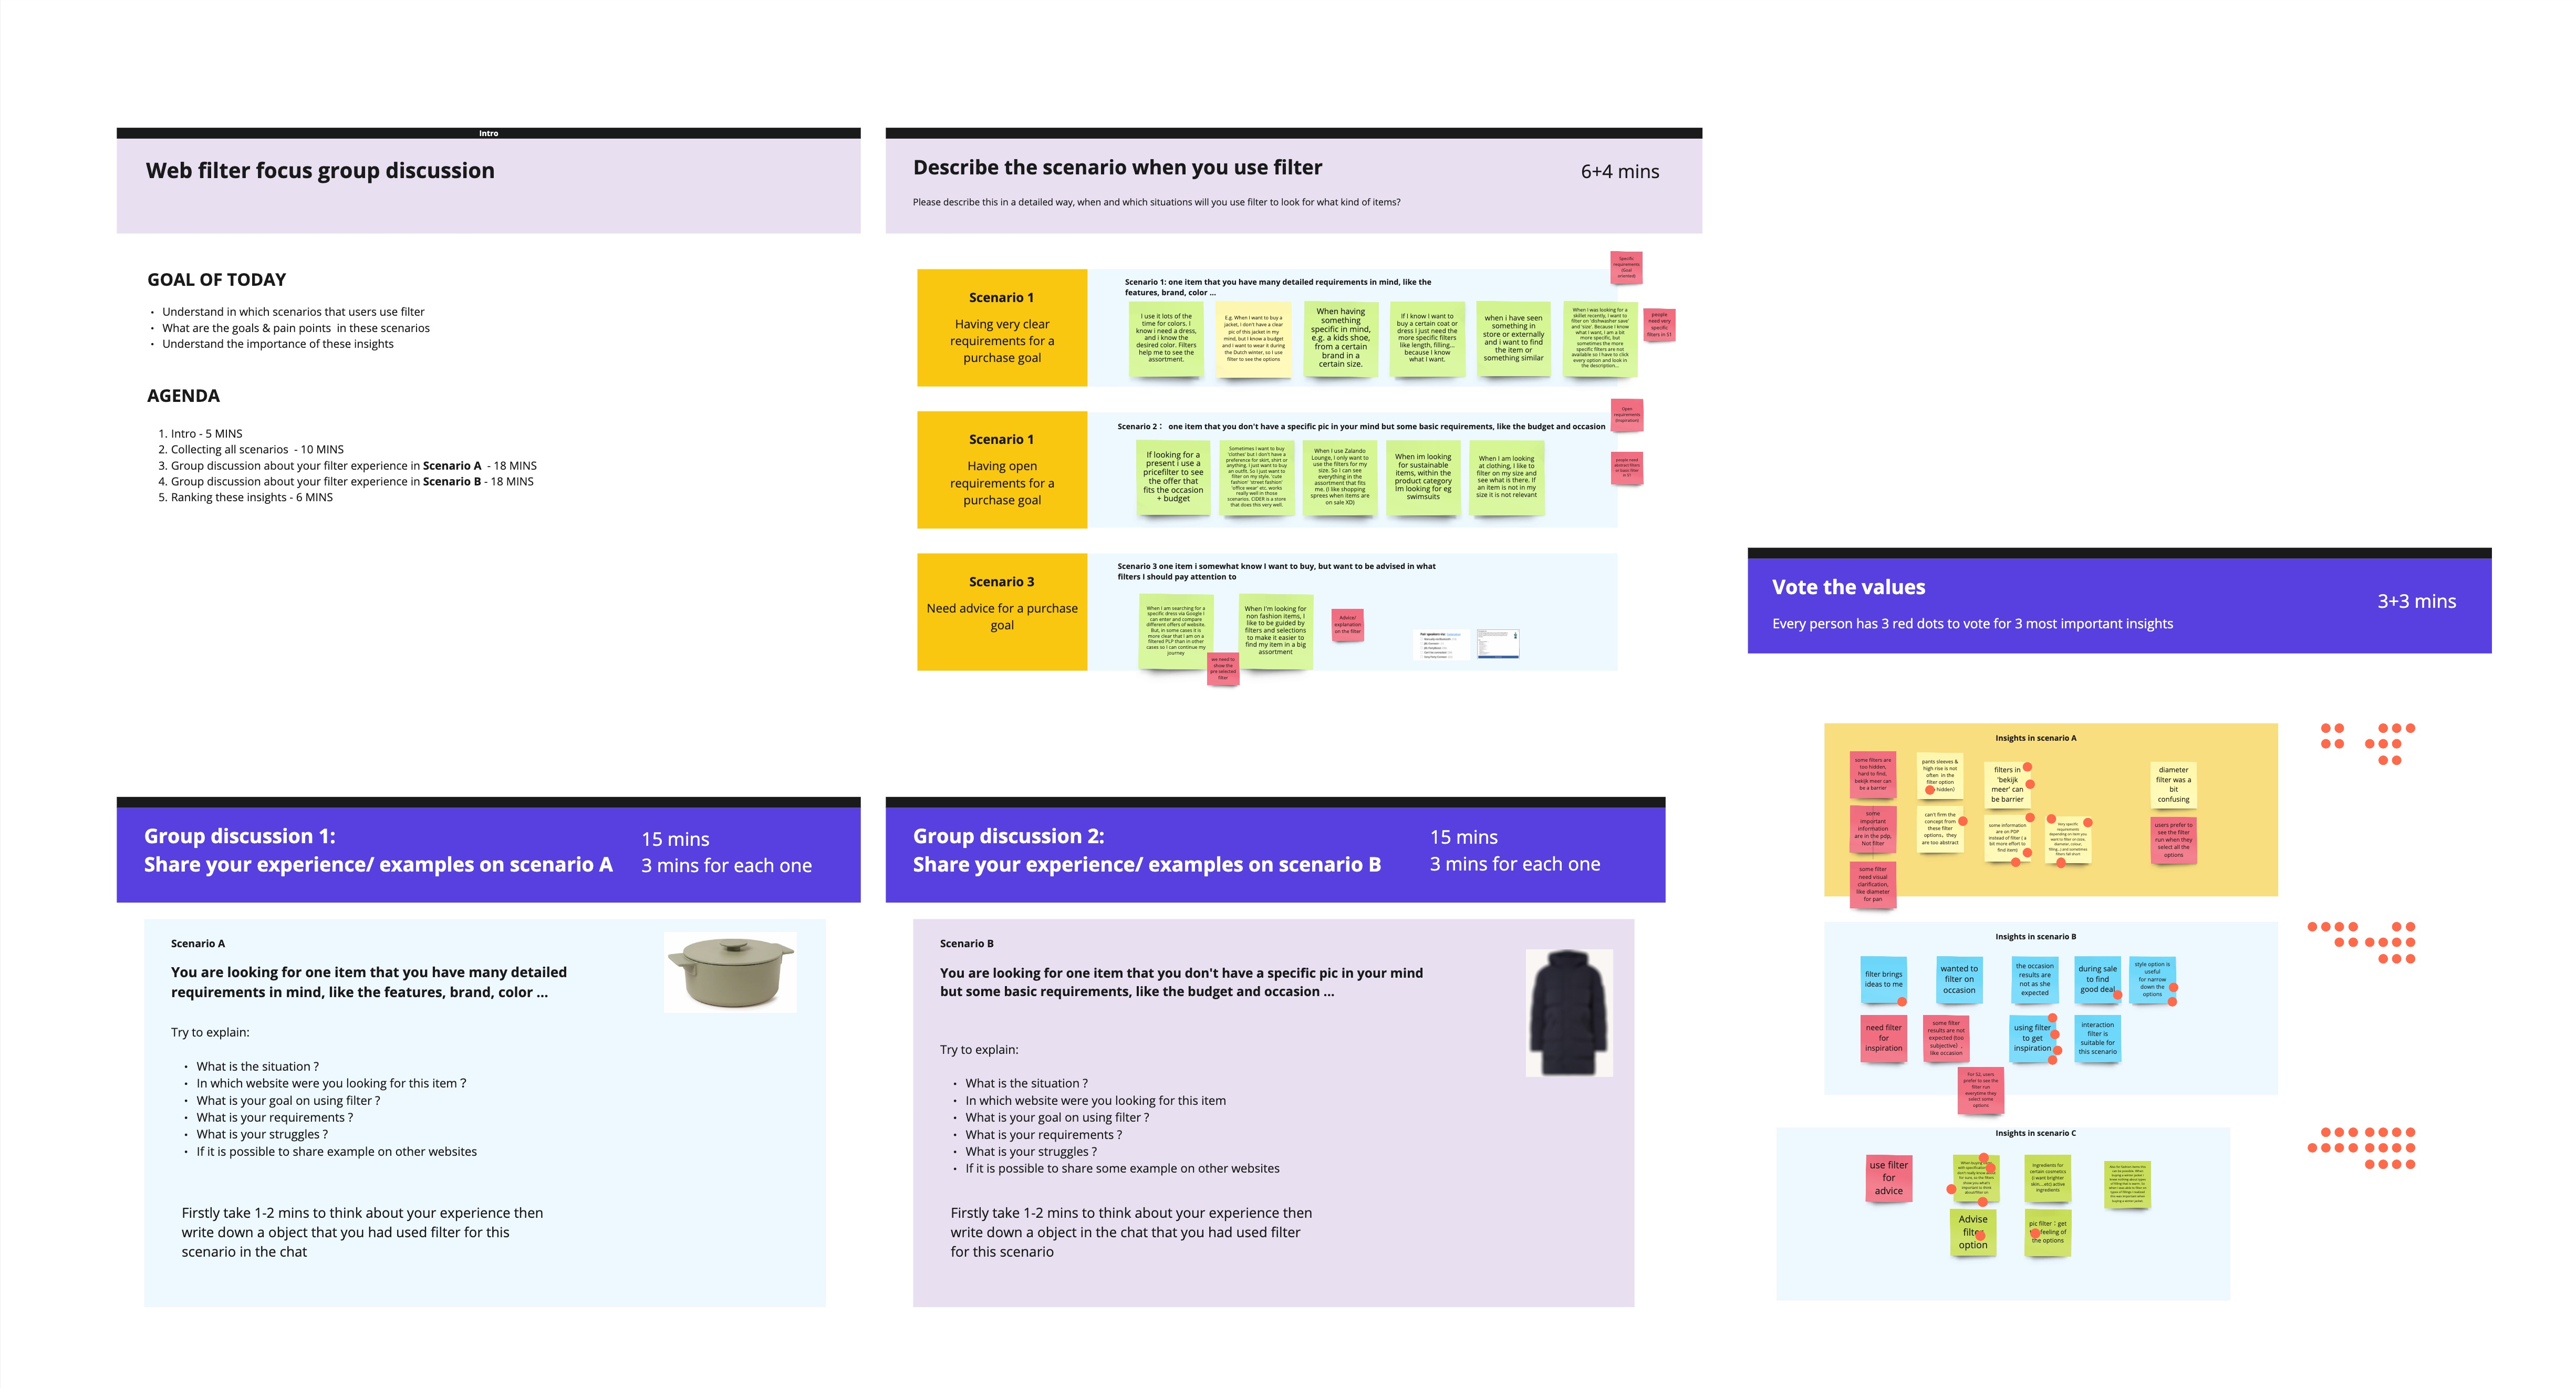
Focus group discussion miro board
After this session, I found there are 2 main scenarios for filter usage and also discovered what kind of filter interaction do they prefer in different scenarios:
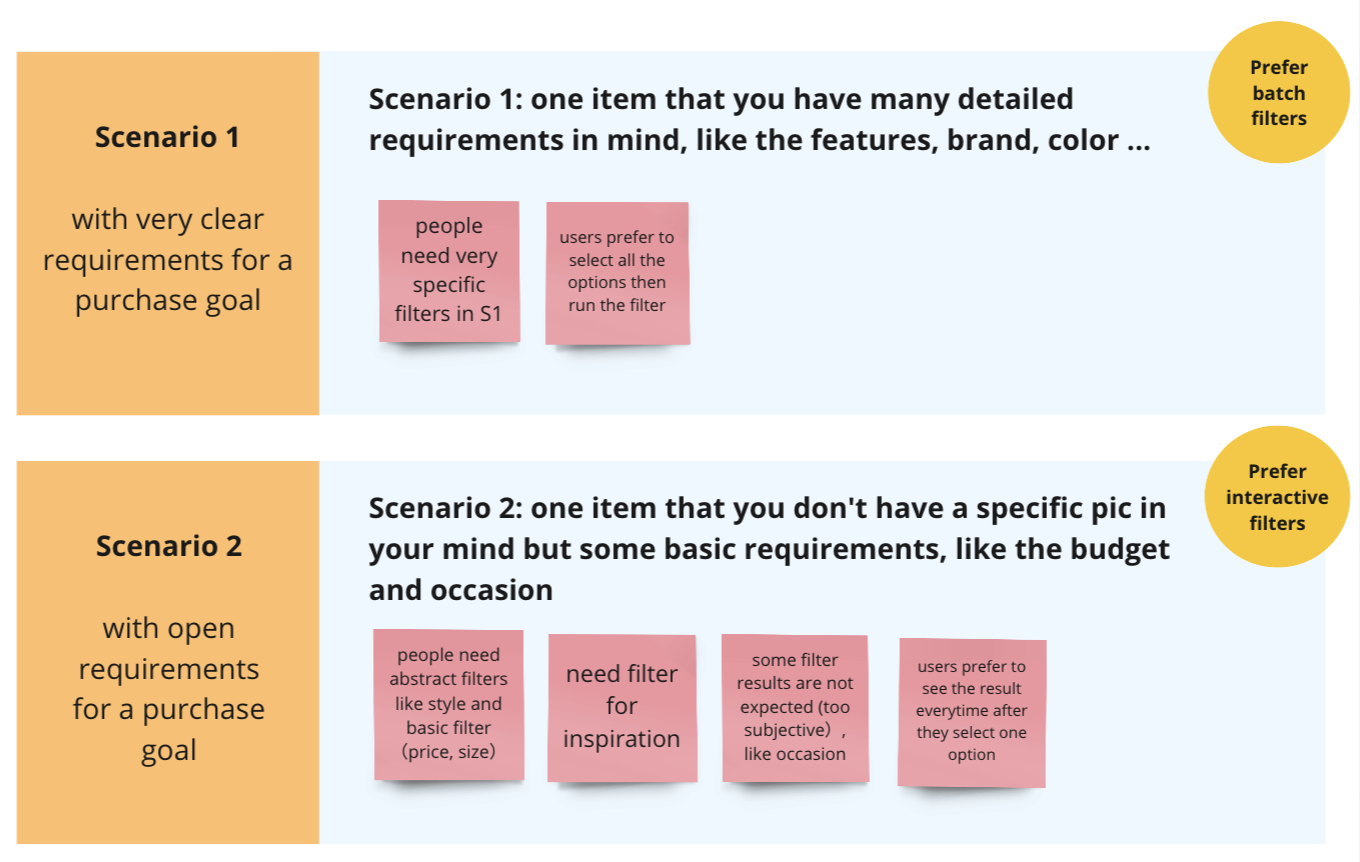
Partial insight of the focus group discussion
Design Decisions Based on Data
With varying user requirements across different scenarios, the challenge is to determine which requirements to prioritise into the design.

Based on the data, there are 66% users come with a specific purchase goal, which is the scenario 1 in the focus group discussion. Both the result of my focus group discussion & Nielsen Norman group research both indicate this type of users’ preference is batch filters ( users adjust multiple filters before the results of the compound query are returned ).

Furthermore, the "batch filters" are also used in the current mobile version, from the data that we know it performs better than the interactive filters (The results returned after each filter value) on desktop. Based on these findings, the decision was made to integrate "batch filters" into the redesign.
Design solution
The Hypothesis:
By updating the filter design, users can find more relevant products, leading to an increase in the conversion rate.
This is a GIF
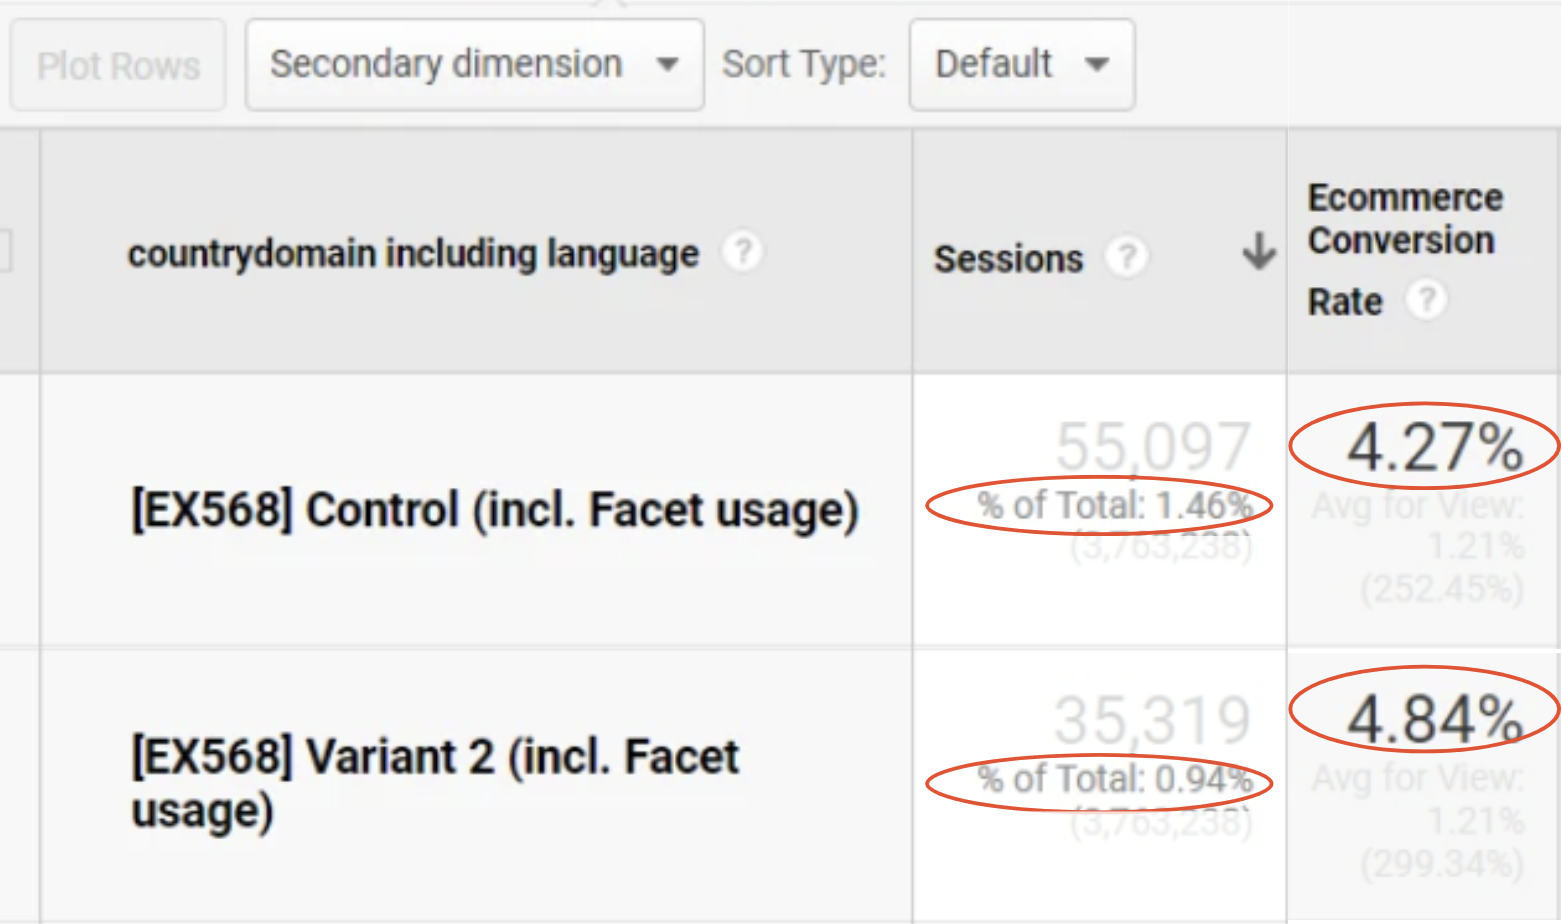
The AB Test result
The finding
What is the reason that the variant group did not perform as well as expected? After I looked into the details, I found that the variant group had lower filter usage but a higher conversion rate in the sessions, so the low filter usage led to a negative impact, and it is probably because of the filter button visibility is low.
![]()
- Click-through rate in the variant group was slightly lower than the control group.
- Conversion rates remained almost the same.
The finding
What is the reason that the variant group did not perform as well as expected? After I looked into the details, I found that the variant group had lower filter usage but a higher conversion rate in the sessions, so the low filter usage led to a negative impact, and it is probably because of the filter button visibility is low.
Iteration and Outcome
The visibility of the filter button is low was identified as a potential issue. In the iteration, I integrated both batch and interactive filters, providing users with easy access to the most frequently used filters. But still keep the batch filtering for these users who prefer it.
Iteration
![]()
Iteration design
The iteration test result
- Filter interactive rate was 8% higher than the control group.
- Product detail page click through rate increased by 6.2%
- Increased the conversion rate by 6.1%
Learnings
Every experiment serves as an opportunity for learning, and even a failed experiment can be incredibly valuable when we uncover the reasons behind its failure.
I like to view each experiment as a detective story 🕵️ . The primary metrics represent the outcomes, and the meticulous data tracking reveals valuable evidence hided in seemingly unremarkable corners 🔍.